Local Roots: an AI-assisted app for sustainable farming
An original app concept, taken from a blank page to a tested prototype. Beginner growers and large-scale farmers were juggling several apps to do one job; Local Roots pulls forecasting, plant care, and predictive analytics into a single screen.
Ideation & creation
Local Roots didn't start as a brief. It started as a question: what would it take to make sustainable farming practices accessible enough that everyday growers would actually adopt them?
There was no client and no existing app to redesign. I chose the problem myself: agricultural methods that cut carbon emissions, convert waste into carbon credits, and reduce deforestation exist, but they're scattered and hard for the people who'd use them to find, understand, or act on. I decided to design the thing that would fix that.
From there, I owned the entire process. I researched sustainable agricultural practices and their environmental impact, then translated that research into journey maps, user personas, and flows for the people who'd actually use the app. I built the information architecture and feature list from scratch, moved from early sketches to high-fidelity wireframes, and prototyped and tested the result in Figma, all within a four-month production timeline I set and kept myself.
This case study isn't a redesign exercise or a response to a brief. It's proof I can take a problem from a blank page to a working, tested product, on my own.
The problem
Looking at the apps already on the market made the gap obvious. Growers were stitching together separate tools for weather, for plant care, for analytics. Nothing covered a beginner's first vegetable patch and a large-scale operation's yield forecast in the same place.
- One app, not severalForecasting, plant needs, and analytics under a single login
- Free to startA basic tier that works, with subscription features layered on top
- Legible analyticsPredictive insight, not a wall of raw data
Research
I started by writing down the questions I actually needed answered:
- What form of teaching would help beginners start their farming journey?
- What challenges and needs do farmers experience, and what solutions might help?
- What features or tools would serve both tech-savvy and non-tech-savvy farmers?
I answered them through desk research: I audited the agriculture apps already on the market for what they offered and what they missed, looked at which regions lean hardest on agriculture, and read published work on who is actually farming in the United States and what their operations look like financially.
What the research pointed to
- Beginners need visual aids and step-by-step instruction, not documentation.
- Affordability is a shared concern from first-timers through to advanced growers.
- Both small-scale and big-picture analytics are useful — to different people.
- Predictive insight beats historical data.
- Advanced farmers are the most eager to adopt modern technology, drones included.
The literature backed up who I was designing for. Most beginning farmers are middle-aged and come to it from another career, and only about 46 percent of intermediate farms post positive farm income — which is exactly why an affordable free tier mattered more than another premium dashboard.
Three growers, three jobs
These are constructed archetypes, built from the desk research rather than from interviews — a way to hold three different sets of needs in view while designing, not a claim about five real people. Rather than average them into one composite, I made them pull in genuinely different directions — a beginner, an intermediate grower short on time, and a large-scale farmer who wants prediction. Designing for all three at once is what forced the app to stay simple.
Jessica Carter
Beginner · Houston, TX
Works a remote marketing job and recently moved. Farming is a new hobby and a way to meet people, but she has struggled to get started.
- Goal
- Grow organic vegetables for local markets, family, and friends — sustainably.
- Pain
- Seasonal planning and crop selection; needs affordable solutions.
- Behaviour
- Eager but overwhelmed by conflicting information online. Prefers visual, step-by-step guides.
Jason Mendoza
Intermediate · Manager at Home Depot
A few years into farming, splitting time between a full-time job and his crops.
- Goal
- Improve yield and efficiency; stop wasting money on unnecessary pesticide.
- Pain
- Affordable tech is hard to find, and operations eat the hours he doesn't have.
- Behaviour
- Wants automated insight and alerts — not a dataset to analyse himself.
John Singh
Advanced · Large-scale operation
Fifty years old, supplying local grocery stores, and actively adopting modern methods.
- Goal
- AI and predictive analytics across the whole operation.
- Pain
- Needs prediction, not dashboards; worried about climate volatility hitting production.
- Behaviour
- Comfortable with technology, but still wants a friendly dashboard.
Each persona came with a written scenario — Jessica checking the forecast against her plants, Jason opting into pest alerts, John pulling predictive insight from the analytics page — and those scenarios became the navigation. Five destinations, no more: home dashboard, analytics, my farm, help, and settings.
From sketches to screens
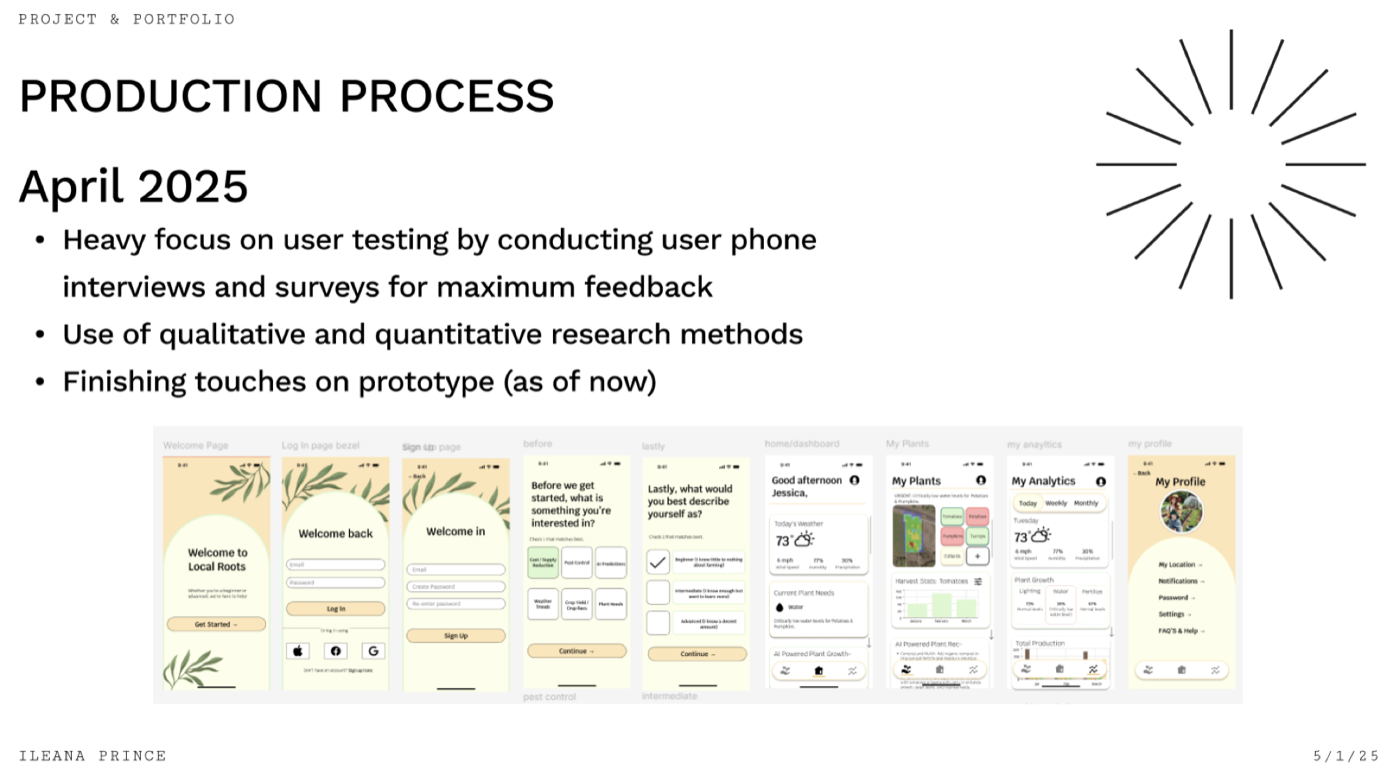
February closed with final sketches. March was the month of turning them into high-fidelity screens and iterating on feedback from peers and professors. The onboarding carries a lot of weight: before the dashboard appears, the app asks what you're interested in — pest control, AI predictions, crop yield, plant needs — and how you'd describe yourself, from beginner to advanced. Those two questions personalise both the dashboard and the subscription offer.
Feedback, and what changed
April was for putting the prototype in front of people. This was a studio project, so the design went through the loop a studio is built around: critique with my cohort and instructor, where you bring screens and take the criticism. Alongside that I sat five people down with the prototype informally — none of them farmers, most of them new to the subject, which is close to the beginner the app is pitched at.
I gave them eight tasks — find the profile page, describe how you'd reach the FAQ, change the harvest stats to a different plant, find this month's pumpkin production, check the chance of rain — then asked what frustrated them, how the onboarding felt, and whether the language made sense. It wasn't a recruited study, and I'd run it differently now. It still did the job that matters: it showed me where the design assumed knowledge the person didn't have.
What worked
- Ease of navigation and the onboarding flow.
- The overall minimalist look of the app.
- Language that stayed readable even for beginners.
What came back as a problem
- A tutorial at the start, so first-time users can find where things live.
- More personalisation than a screen that just repeats “log in” and “sign up”.
- A homepage that holds its own visually against the other pages — more contrast, clearer hierarchy.
Those went straight back into the design. The login screen became a “Welcome back” with multiple sign-in options and a sign-up route at the bottom that leads to its own welcome page. The self-description step became the hook for personalised offers. May was spent on the tutorial, the subscription packages covering drone and seed-pod tech, and tightening the high-fidelity screens.
Where it landed
Four months took Local Roots from a couple of sketches to a working prototype with a seamless onboarding path, analytics a beginner can read, and a basic free plan. The paid tier was there to make the app viable as a business — an $8 monthly option with rewards, no ads, and the premium analytics — sitting alongside the free plan rather than replacing it.
I still consider it unfinished in the good way. The tutorial, the subscription packages, and the personalised dashboards are the threads I'm still pulling on.
Project files
Opens in Figma, in a new tab.